One Parameter Models
PSYC 573
University of Southern California
February 01, 2022
An Example of Bernoulli Data
Data (Subsample)
- Patients diagnosed with AIDS in Australia before 1 July 1991
| state | sex | diag | death | status | T.categ | age |
|---|---|---|---|---|---|---|
| VIC | M | 1991-03-05 | 1991-07-01 | A | hs | 36 |
| NSW | M | 1987-08-30 | 1988-03-11 | D | hs | 25 |
| QLD | M | 1989-10-09 | 1990-08-22 | D | hs | 36 |
| NSW | M | 1991-03-17 | 1991-07-01 | A | hs | 42 |
| NSW | M | 1986-04-12 | 1989-01-31 | D | hs | 40 |
| NSW | M | 1986-09-29 | 1987-03-25 | D | hs | 69 |
| NSW | M | 1989-08-24 | 1991-07-01 | A | hs | 37 |
| Other | F | 1988-10-19 | 1991-07-01 | A | id | 30 |
| NSW | M | 1990-04-07 | 1991-01-21 | D | hs | 30 |
| NSW | M | 1988-04-28 | 1990-04-07 | D | hs | 41 |

Image credit: Wikimedia Commons

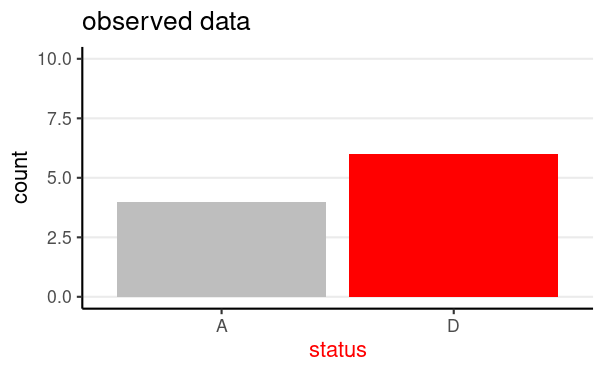
Image credit: Wikimedia Commons


Let's go through the Bayesian crank
Image credit: Wikimedia Commons
Choose a Model: Bernoulli
Data: y = survival status (0 = "A", 1 = "D")
Parameter: θ = probability of "D"
Model equation: yi∼Bern(θ) for i=1,2,…,N
- The model states:
the sample data y follows a Bernoulli distribution with the common parameter θ
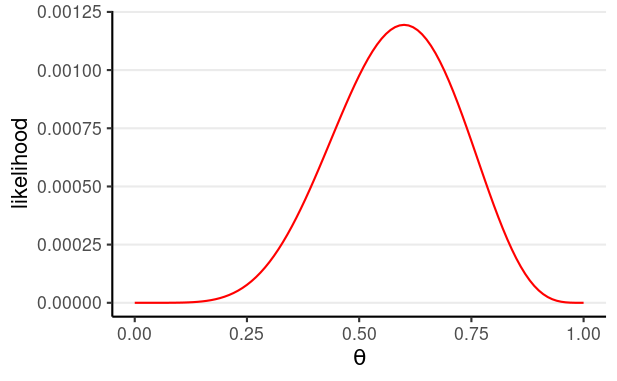
Bernoulli Likelihood
Notice that there is no subscript for θ:
- The model assumes each observation has the same θ
- I.e., the observations are exchangeable
P(y1,y2,…,yN)=θz(1−θ)N−z
z = number of "successes" ("D")
- z = 6 in this illustrative sample
| theta | likelihood |
|---|---|
| 0.0 | 0.00000 |
| 0.1 | 0.00000 |
| 0.2 | 0.00003 |
| 0.3 | 0.00018 |
| 0.4 | 0.00053 |
| 0.5 | 0.00098 |
| 0.6 | 0.00119 |
| 0.7 | 0.00095 |
| 0.8 | 0.00042 |
| 0.9 | 0.00005 |
| 1.0 | 0.00000 |
| theta | likelihood |
|---|---|
| 0.0 | 0.00000 |
| 0.1 | 0.00000 |
| 0.2 | 0.00003 |
| 0.3 | 0.00018 |
| 0.4 | 0.00053 |
| 0.5 | 0.00098 |
| 0.6 | 0.00119 |
| 0.7 | 0.00095 |
| 0.8 | 0.00042 |
| 0.9 | 0.00005 |
| 1.0 | 0.00000 |
Choosing Priors
Specify a Prior
When choosing priors, start with the support of the parameter(s)
- Values that are possible
Support for θ: [0, 1]
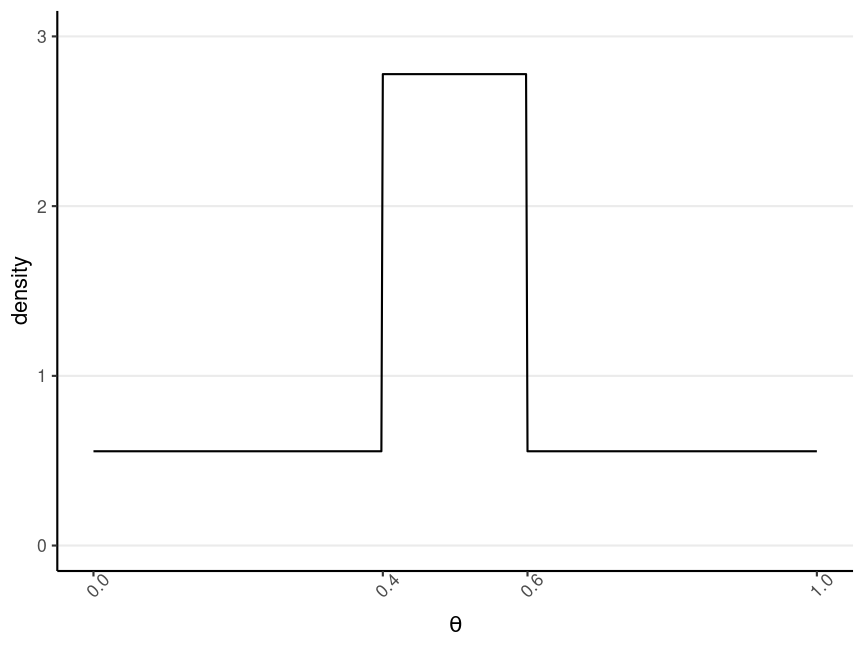
One Possible Option
Prior belief: θ is most likely to be in the range [.40,.60), and is 5 times more likely than any values outside of that range"
Conjugate Prior: Beta Distribution
Conjugate Prior: yield posterior in the same distribution family as the prior
Some other conjugate distributions: https://en.wikipedia.org/wiki/Conjugate_prior#Table_of_conjugate_distributions
Two hyperparameters, a and b:
- a−1 = number of prior 'successes' (e.g., "D")
- b−1 = number of prior 'failures'
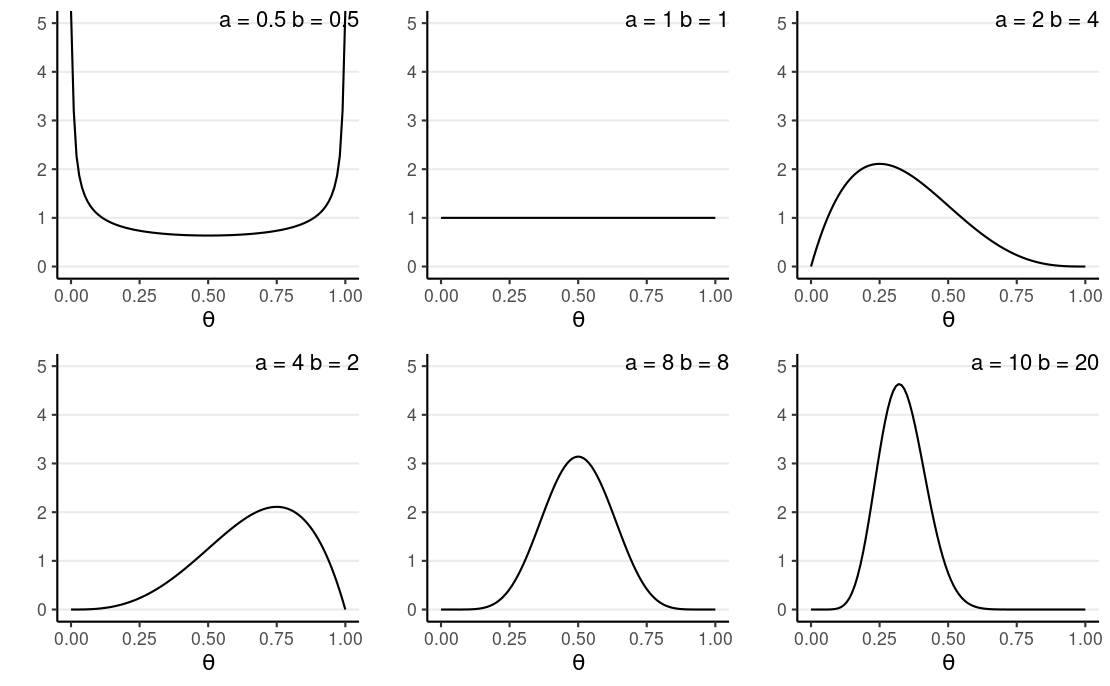
When a>b, more density to the right (i.e., larger θ), and vice versa
Mean = a/(a+b)
Concentration = κ=a+b; ↑κ, ↓ variance, ↑ strength of prior
E.g., A Beta(1, 1) prior means 0 prior success and 0 failure
- i.e., no prior information (i.e., noninformative)
Notes on Choosing Priors
Give > 0 probability/density for all possible values of a parameter
When the prior contains relatively little information
- different choices usually make little difference
Do a prior predictive check
Sensitivity analyses to see how sensitive results are to different reasonable prior choices.
Getting the Posterior
Obtaining the Posterior Analytically
P(θ∣y)=P(y∣θ)P(θ)∫10P(y∣θ∗)P(θ∗)dθ∗
The denominator is usually intractable
Obtaining the Posterior Analytically
P(θ∣y)=P(y∣θ)P(θ)∫10P(y∣θ∗)P(θ∗)dθ∗
The denominator is usually intractable
Conjugate prior: Posterior is from a known distribution family
- N trials and z successes
- Beta(a,b) prior
- ⇒ Beta(a+z,b+N−z) posterior
- a+z−1 successes
- b+N−z−1 failures
Back to the Example
N = 10, z = 6
Prior: Do you believe that the fatality rate of AIDS is 100%? or 0%?
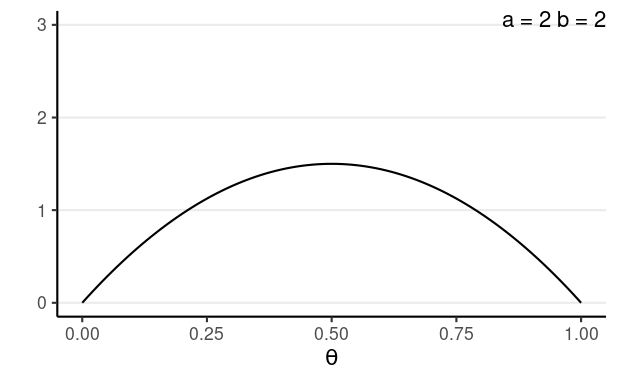
- Let's use κ=4, prior mean = 0.5, so a = 2 and b = 2
Summarizing the Posterior
If the posterior is from a known family, one can evalue summary statistics analytically
- E.g., E(θ∣y)=∫10θP(θ∣y)dθ
However, more often, a simulation-based approach is used to draw samples from the posterior
num_draws <- 1000sim_theta <- rbeta(1000, shape1 = 8, shape2 = 6)| Statistic | Common name | Value |
|---|---|---|
| mean | Bayes estimate/Expected a posteriori (EAP) | 0.563 |
| median | Posterior median | 0.567 |
| mode | Maximum a posteriori (MAP) | 0.577 |
| SD | Posterior SD | 0.126 |
| MAD | MAD | 0.13 |
| 80% CI | (Equal-tailed) Credible interval | [0.398, 0.727] |
| 80% HDI | HDI/Highest Posterior Density Interval (HPDI) | [0.404, 0.733] |
Use the Full Data
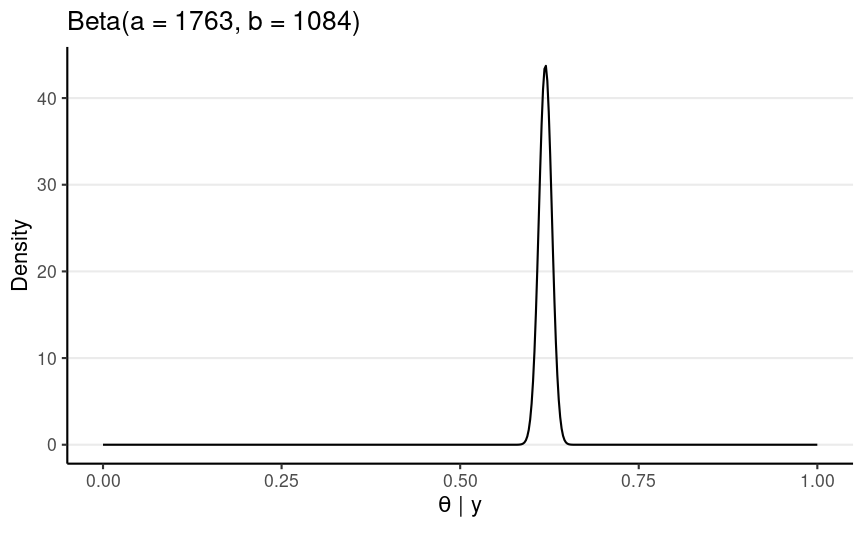
1082 A, 1761 D → N = 2843, z = 1761
Posterior: Beta(1763, 1084)
Posterior Predictive Check
Posterior Predictive Check
~y = new/future data
Posterior predictive: P(~y∣y)=∫P(~y∣θ,y)P(θ∣y)dθ
Posterior Predictive Check
~y = new/future data
Posterior predictive: P(~y∣y)=∫P(~y∣θ,y)P(θ∣y)dθ
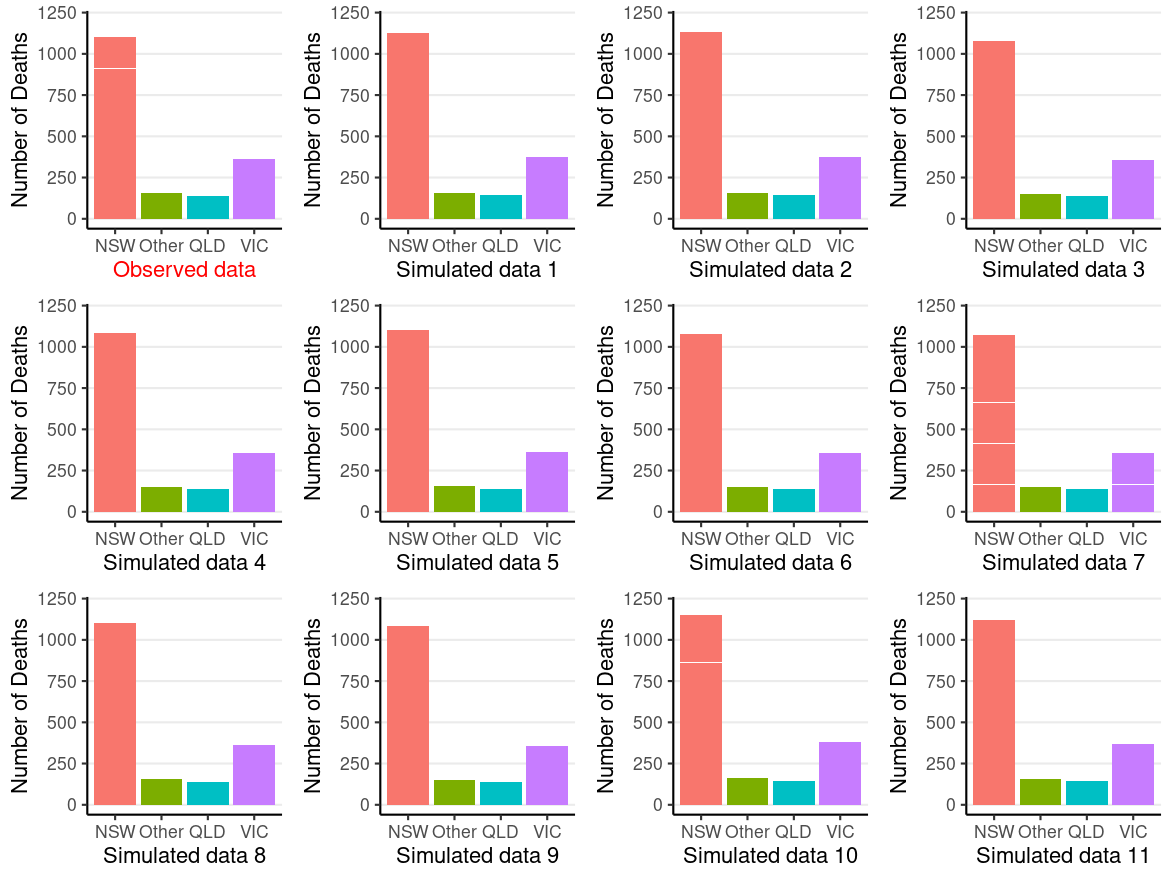
Simulate θ∗ from posterior --> for each θ∗, simulate a new data set
Posterior Predictive Check
~y = new/future data
Posterior predictive: P(~y∣y)=∫P(~y∣θ,y)P(θ∣y)dθ
Simulate θ∗ from posterior --> for each θ∗, simulate a new data set
If the model does not fit the data, any results are basically meaningless at best, and can be very misleading
Requires substantive knowledge and some creativity
- E.g., are the case fatality rates equal across the 4 state categories?
Posterior Predictive Check
Some common checks:
- Does the model simulate data with similar distributions as the observed data?
- e.g., skewness, range
- Subsets of observed data that are of more interest?
- e.g., old age group
- If not fit, age should be incorporated in the model
See an example in Gabry et al. (2019)
Using bayesplot

Darker line = observed proportion of "D"; histogram = simulated plausible statistics based on the model and the posterior
The model with one-parameter, which assumes exchangeability, does not fit those age 50+
- May need more than one θ
# Create an age group indicatorage50 <- factor(Aids2$age > 50, labels = c("<= 50", "> 50"))# Draw posterior samples of thetapost_sample <- rbeta(1e4, 1807, 1116)# Initialize an S by N matrix to store the simulated datay_tilde <- matrix(NA, nrow = length(post_sample), ncol = length(Aids2$status))for (s in seq_along(post_sample)) { theta_s <- post_sample[s] status_new <- sample(c("D", "A"), nrow(Aids2), replace = TRUE, prob = c(theta_s, 1 - theta_s) ) y_tilde[s,] <- as.numeric(status_new == "D")}bayesplot::ppc_stat_grouped( as.numeric(Aids2$status == "D"), yrep = y_tilde, group = age50)Other One-Parameter Models
Binomial Model
- For count outcome: yi∼Bin(Ni,θ)
- θ: rate of occurrence (per trial)
- Conjugate prior: Beta
- E.g.,
- y minority candidates in N new hires
- y out of N symptoms checked
- A word appears y times in a tweet of N number of words
Poisson Model
- For count outcome: yi∼Pois(θ)
- θ: rate of occurrence
- Conjugate prior: Gamma
- E.g.,
- Drinking y times in a week
- y hate crimes in a year for a county
- y people visiting a store in an hour
