Markov Chain Monte Carlo
PSYC 573
University of Southern California
February 10, 2022
Monte Carlo
Monte Carlo (MC) Methods

Image credit: Wikimedia Commons
Monte Carlo (MC) Methods

1930s and 40s: answer questions in nuclear physics not solvable with conventional mathematical methods
- Key figures: Stanislaw Ulam, John von Neumann, Nicholas Metropolis
Central element of the Manhattan Project in the development of the hydrogen bomb
Image credit: Wikimedia Commons
MC With One Unknown
rbeta(), rnorm(), rbinom(): generate values that imitate independent samples from known distributions
- use pseudorandom numbers
E.g., rbeta(n, shape1 = 15, shape2 = 10)
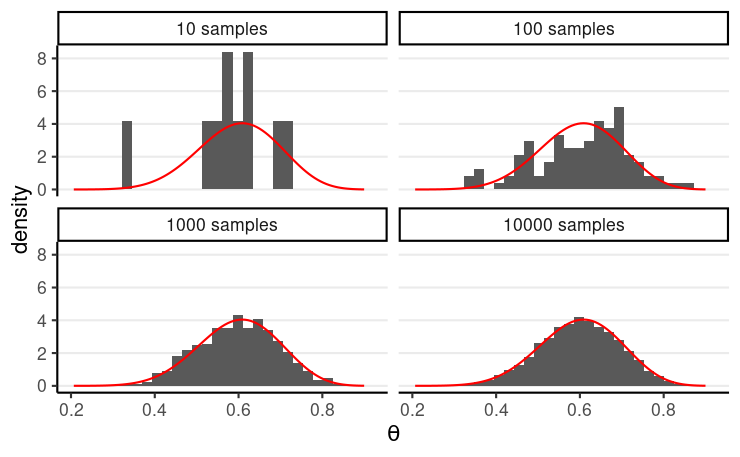
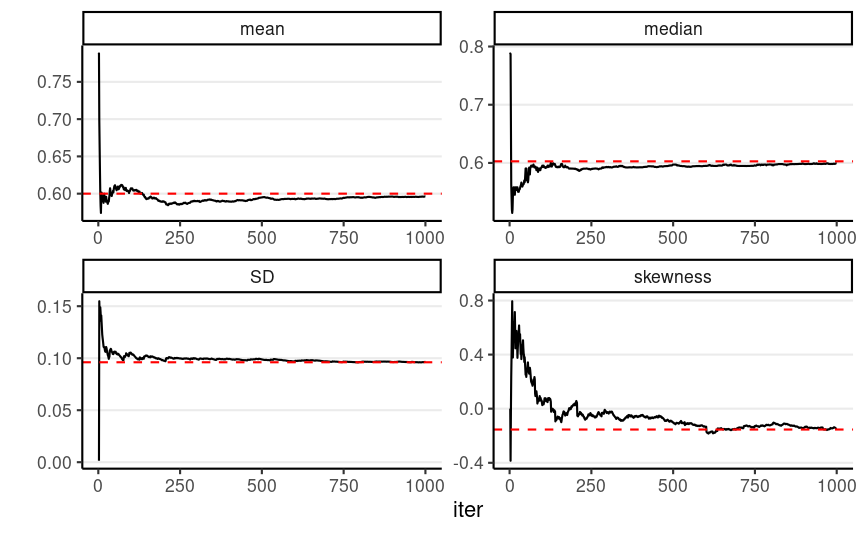
With a large number of draws (S),
- sample density → target distribution
- most sample statistics (e.g., mean, quantiles) → corresponding characteristics of the target density
Markov Chain Monte Carlo
MCMC
Main problem in Bayesian: no way to draw independent samples from posterior P(θ∣y)=e−(θ−1/2)2θy(1−θ)n−y∫10e−(θ∗−1/2)2θ∗y(1−θ∗)n−ydθ∗
MCMC: draw dependent (correlated) samples without evaluating the integral in the denominator
- Some commonly used algorithms:
- The Metropolis algorithm (also called random-walk Metropolis)
- Gibbs sampling (in BUGS, JAGS)
- Hamiltonian Monte Carlo (and No-U-Turn sampler; in STAN)
The Metropolis Algorithm
An Analogy

You have a task: tour all regions in LA county, and the time your spend on each region should be proportional to its popularity
However, you don't know which region is the most popular
Each day, you will decide whether to stay in the current region or move to a neighboring region
You have a tour guide that tells you whether region A is more or less popular than region B and by how much
How would you proceed?
Image credit: Wikimedia Commons
Using the Metropolis Algorithm
- On each day, randomly select a new region
- If the proposed region is more popular than the current one, definitely go to the new region
- If the proposed region is less popular than the current one, go to the new region with
P(accept the new region)=proposed region popularitycurrent region popularity- E.g., by spinning a wheel
In the long run, distribution of time spent in each region = distribution of popularity of each region
Demonstration
shiny::runGitHub("metropolis_demo", "marklhc")Example 1: Estimating the Number of People Taking the Metro
Data from LA Barometer (by the USC Dornsife Center for Economic and Social Research)
338 first-gen immigrants, 86 used the metro in the previous year
Question:
What proportion of first-gen immigrants uses the metro in a year?
Press release: https://dornsife.usc.edu/news/stories/3164/labarometer-mobility-in-los-angeles-survey/
Analytic Method
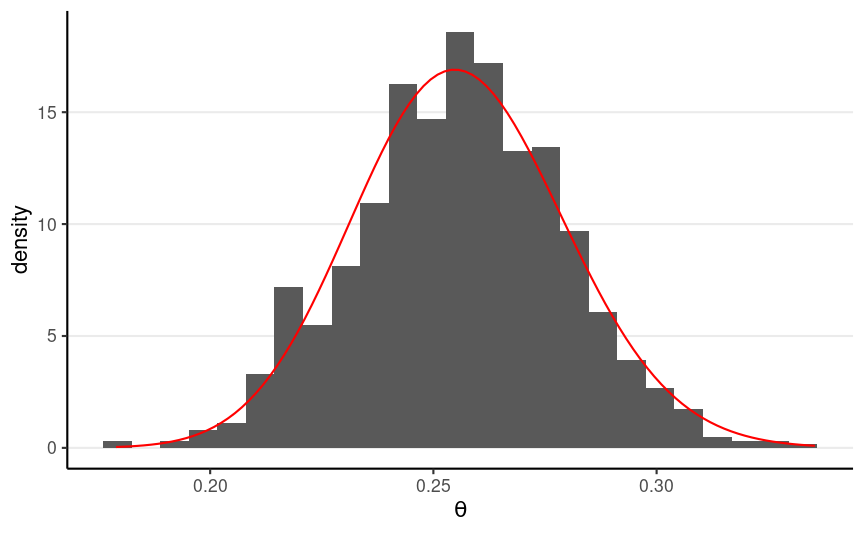
Beta(1.5, 2) prior → Beta(87.5, 254) posterior
1,000 independent draws from the posterior:
With the Metropolis Algorithm
Proposal density: N(0,0.1); Starting value: θ(1)=0.1
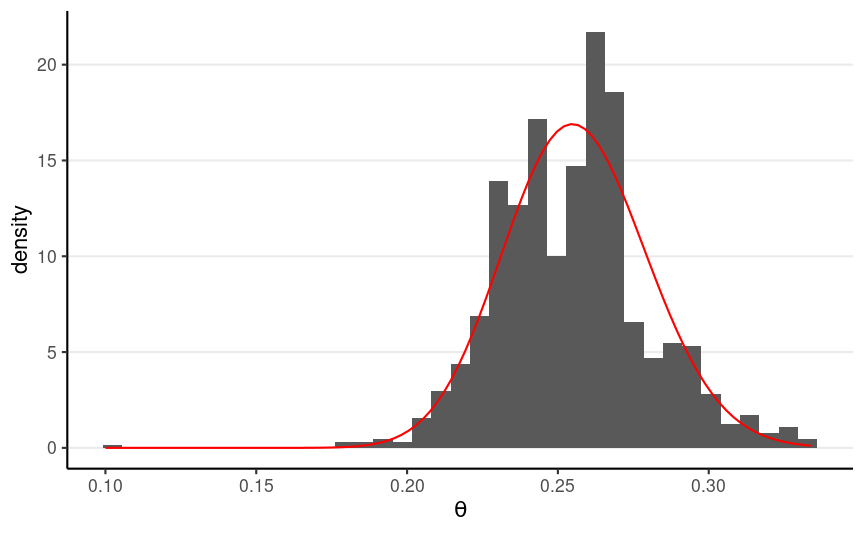
R code for running the algorithm can be found in the note
With enough iterations, the Metropolis will simulate samples from the target distribution
It is less efficient than rbeta because the draws are dependent
With enough iterations, the Metropolis will simulate samples from the target distribution
It is less efficient than rbeta because the draws are dependent
Pros:
- does not require solving the integral
- can use non-conjugate priors
- easy to implement
Cons:
- not efficient; not scalable in complex models
- require tuning the proposal SD;
MCMC Diagnostics
Markov Chain
Markov chain: a sequence of iterations, {θ(1),θ(2),…,θ(S)}
- the "state" θ(s) depends on θ(s−1)
- where to travel next depends on where the current region is
Based on ergodic theorems, a well-behaved chain will reach a stationary distribution
- after which, every draw is a sample from the stationary distribution
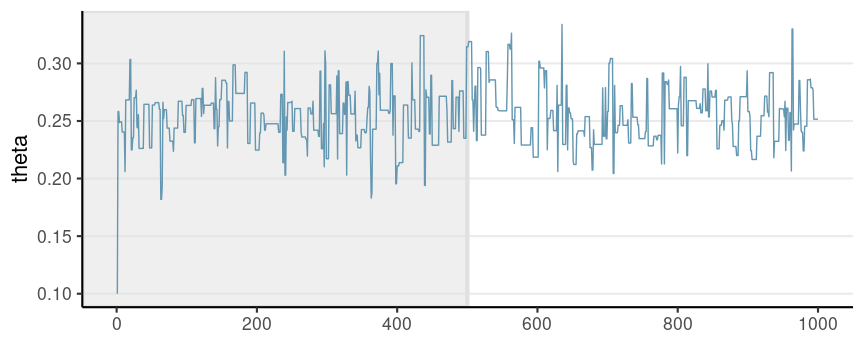
Warm-up
It takes a few to a few hundred thousand iterations for the chain to get to the stationary distribution
Therefore, a common practice is to discard the first Swarm-up (e.g., first half of the) iterations
- Also called burn-in
When Can We Use MCMC Draws to Approximate the Posterior?
- The draws need to be representative of the posterior
- The draws contain sufficient information to accurately describe the posterior
When Can We Use MCMC Draws to Approximate the Posterior?
- The draws need to be representative of the posterior
- The draws contain sufficient information to accurately describe the posterior
Tools
- Trace plots/Rank histograms
- ^R
- Effective sample size (ESS)
Representativeness
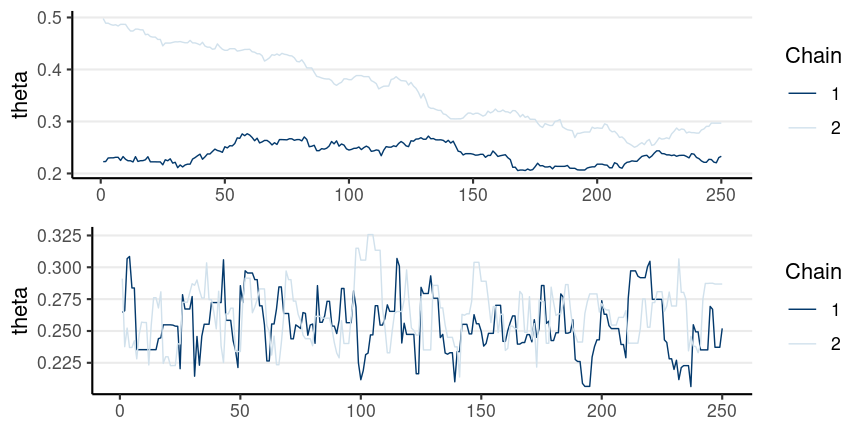
The chain does not get stuck
Mixing: multiple chains cross each other
Representativeness
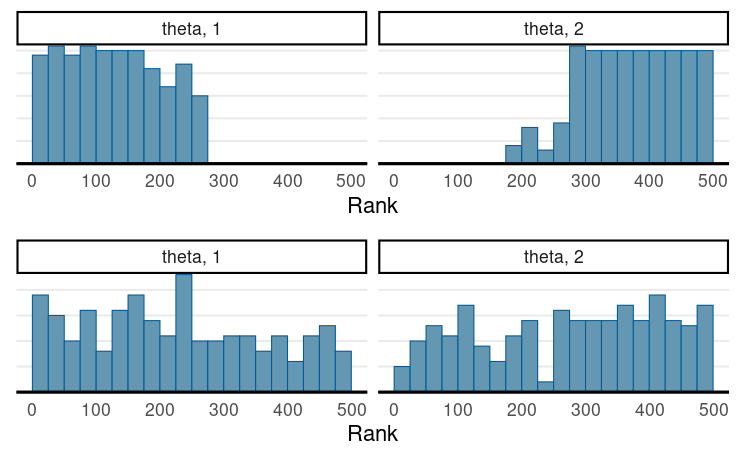
For more robust diagnostics (Vehtari et al., 2021, doi: 10.1214/20-BA1221)
- The rank histograms should look like uniform distributions
Representativeness
^R=Between-chain variance+within-chain variancewithin-chain variance
- aka: Gelman-Rubin statistic, the potential scale reduction factor
Representativeness
^R=Between-chain variance+within-chain variancewithin-chain variance
- aka: Gelman-Rubin statistic, the potential scale reduction factor
When the chains converge, each should be exploring the same stationary distribution
- No between-chain differences ⇒ ^R→1
- Vehtari et al. (2021) recommended ^R<1.01 for convergence
In the previous examples,
- ^R = 2.044 for the poor mixing graph
- ^R = 1.033 for the good mixing graph
Effective Sample Size (ESS)
MCMC draws are dependent, so they contain less information for the target posterior distribution
What is the equivalent number of draws if the draws were independent?
- E.g., ESS = 98.289 for the good mixing example
- Need ~5087.022 draws to get equal amount of information as 1,000 independent samples
Heuristics for ESS
- ESS (bulk and tail) > 400 to interpret ^R (Vehtari et al., 2021)
- ESS > 1000 for stable summary of the posterior
- Kruschke (2015) recommended 10,000
Sample Convergence Paragraph
We used Markov Chain Monte Carlo (MCMC), specifically a Metropolis algorithm implemented in R, to approximate the posterior distribution of the model parameters. We used two chains, each with 10,000 draws. The first 5,000 draws in each chain were discarded as warm-ups. Trace plots of the posterior samples (Figure X) showed good mixing, and ^R statistics (Vehtari et al., 2021) were < 1.01 for all model parameters, indicating good convergence for the MCMC chains. The effective sample sizes > 2376.931 for all model parameters, so the MCMC draws are sufficient for summarizing the posterior distributions.
Sample Results
The model estimated that 25.569% (posterior SD = 2.328%, 90% CI [21.813%, 29.467%]) of first-generation immigrants took the metro in the year 2019.
Things to Remember
- MCMC draws dependent/correlated samples to approximate a posterior distribution
- ESS < S
- It needs warm-up iterations to reach a stationary distribution
- Check for representativenes
- Trace/Rank plot and ^R
- Need large ESS to describe the posterior accurately