Bayes’ Rule
PSYC 573
University of Southern California
January 25, 2022
Inverse Probability
Conditional probability: P(A∣B)=P(A,B)P(B)
which yields P(A,B)=P(A∣B)P(B) (joint = conditional × marginal)
Inverse Probability
Conditional probability: P(A∣B)=P(A,B)P(B)
which yields P(A,B)=P(A∣B)P(B) (joint = conditional × marginal)
On the other side, P(B∣A)=P(B,A)P(A)
Bayes' Theorem
P(B∣A)=P(A∣B)P(B)P(A)
Which says how can go from P(A∣B) to P(B∣A)
Bayes' Theorem
P(B∣A)=P(A∣B)P(B)P(A)
Which says how can go from P(A∣B) to P(B∣A)
Consider Bi (i=1,…,n) as one of the many possible mutually exclusive events
P(Bi∣A)=P(A∣Bi)P(Bi)P(A)=P(A∣Bi)P(Bi)∑nk=1P(A∣Bk)P(Bk)
A police officer stops a driver at random and does a breathalyzer test for the driver. The breathalyzer is known to detect true drunkenness 100% of the time, but in 1% of the cases, it gives a false positive when the driver is sober. We also know that in general, for every 1,000 drivers passing through that spot, one is driving drunk. Suppose that the breathalyzer shows positive for the driver. What is the probability that the driver is truly drunk?
Gigerenzer (2004)
p value = P(data | hypothesis), not P(hypothesis | data)
Gigerenzer (2004)
p value = P(data | hypothesis), not P(hypothesis | data)
- H0: the person is sober (not drunk)
- data: breathalyzer result
p = P(positive | sober) = 0.01 → reject H0 at .05 level
Gigerenzer (2004)
p value = P(data | hypothesis), not P(hypothesis | data)
- H0: the person is sober (not drunk)
- data: breathalyzer result
p = P(positive | sober) = 0.01 → reject H0 at .05 level
However, as we have been, given that P(H0) is small, P(H0∣data) is still small
Bayesian Data Analysis
Bayes' Theorem in Data Analysis
- Bayesian statistics
- more than applying Bayes's theorem
- a way to quantify the plausibility of every possible value of some parameter θ
- E.g., population mean, regression coefficient, etc
- Goal: update one's Belief about θ based on the observed data D
Going back to the example
Goal: Find the probability that the person is drunk, given the test result
Parameter (θ): drunk (values: drunk, sober)
Data (D): test (possible values: positive, negative)
Going back to the example
Goal: Find the probability that the person is drunk, given the test result
Parameter (θ): drunk (values: drunk, sober)
Data (D): test (possible values: positive, negative)
Bayes' theorem: P(θ∣D)posterior=P(D∣θ)likelihoodP(θ)prior/P(D)marginal
Usually, the marginal is not given, so
P(θ∣D)=P(D∣θ)P(θ)∑θ∗P(D∣θ∗)P(θ∗)
- P(D) is also called evidence, or the prior predictive distribution
- E.g., probability of a positive test, regardless of the drunk status
Example 2
shiny::runGitHub("plane_search", "marklhc")- Try choosing different priors. How does your choice affect the posterior?
- Try adding more data. How does the number of data points affect the posterior?
The posterior is a synthesis of two sources of information: prior and data (likelihood)
Generally speaking, a narrower distribution (i.e., smaller variance) means more/stronger information
- Prior: narrower = more informative/strong
- Likelihood: narrower = more data/more informative
Setting Priors
- Flat, noninformative, vague
- Weakly informative: common sense, logic
- Informative: publicly agreed facts or theories

Prior beliefs used in data analysis must be admissible by a skeptical scientific audience (Kruschke, 2015, p. 115)
Likelihood/Model/Data P(D∣θ,M)
Probability of observing the data as a function of the parameter(s)
- Also written as L(θ∣D) or L(θ;D) to emphasize it is a function of θ
- Also depends on a chosen model M: P(D∣θ,M)

Likelihood of Multiple Data Points
- Given D1, obtain posterior P(θ∣D1)
- Use P(θ∣D1) as prior, given D2, obtain posterior P(θ∣D1,D2)
The posterior is the same as getting D2 first then D1, or D1 and D2 together, if
- data-order invariance is satisfied, which means
- D1 and D2 are exchangeable
Exchangeability
Joint distribution of the data does not depend on the order of the data
E.g., P(D1,D2,D3)=P(D2,D3,D1)=P(D3,D2,D1)
Example of non-exchangeable data:
- First child = male, second = female vs. first = female, second = male
- D1,D2 from School 1; D3,D4 from School 2 vs. D1,D3 from School 1; D2,D4 from School 2
An Example With Binary Outcomes
Coin Flipping
Q: Estimate the probability that a coin gives a head
- θ: parameter, probability of a head
Flip a coin, showing head
- y=1 for showing head
How do you obtain the likelihood?
Bernoulli Likelihood
The likelihood depends on the probability model chosen
- Some models are commonly used, for historical/computational/statistical reasons
One natural way is the Bernoulli model P(y=1∣θ)=θP(y=0∣θ)=1−θ
Bernoulli Likelihood
The likelihood depends on the probability model chosen
- Some models are commonly used, for historical/computational/statistical reasons
One natural way is the Bernoulli model P(y=1∣θ)=θP(y=0∣θ)=1−θ
The above requires separating y=1 and y=0. A more compact way is P(y∣θ)=θy(1−θ)(1−y)
Multiple Observations
Assume the flips are exchangeable given θ,
P(y1,…,yN∣θ)=N∏i=1P(yi∣θ)=θ∑Ni=1yi(1−θ)∑Ni=1(1−yi)=θz(1−θ)N−z
z = # of heads; N = # of flips
Note: the likelihood only depends on the number of heads, not the particular sequence of observations
Posterior
Same posterior, two ways to think about it
Prior belief, weighted by the likelihood
P(θ∣y)∝P(y∣θ)weightsP(θ)
Posterior
Same posterior, two ways to think about it
Prior belief, weighted by the likelihood
P(θ∣y)∝P(y∣θ)weightsP(θ)
Likelihood, weighted by the strength of prior belief
P(θ∣y)∝P(θ)weightsP(θ∣y)
Posterior
Say N = 4 and z = 1
E.g., P(θ∣y1=1)∝P(y1=1∣θ)P(θ)
For pedagogical purpose, we'll discretize the θ into [.05, .15, .25, ..., .95]
- Also called grid approximation
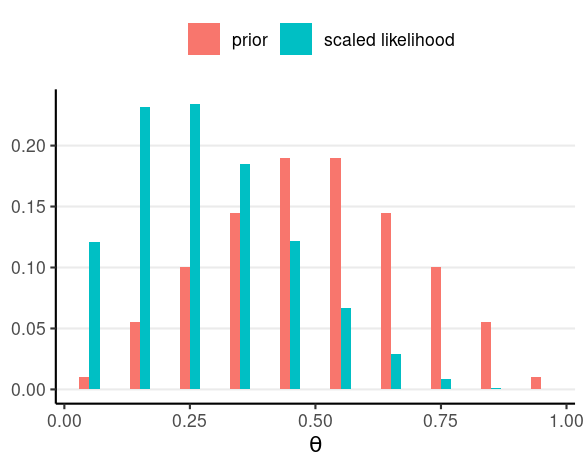
Posterior
Say N = 4 and z = 1
E.g., P(θ∣y1=1)∝P(y1=1∣θ)P(θ)
For pedagogical purpose, we'll discretize the θ into [.05, .15, .25, ..., .95]
- Also called grid approximation

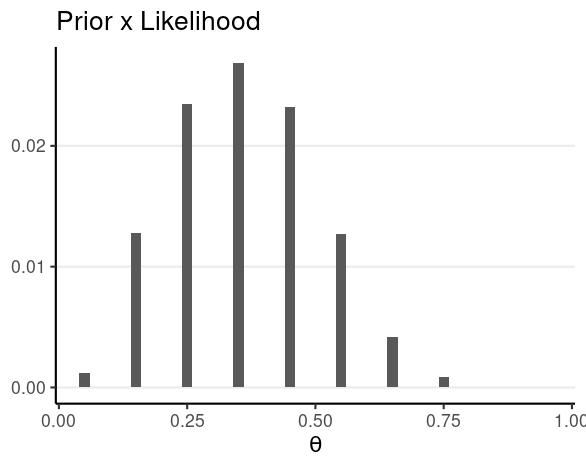
How About the Denominator?
Numerator: relative posterior plausibility of the θ values
We can avoid computing the denominator because
- The sum of the probabilities need to be 1
How About the Denominator?
Numerator: relative posterior plausibility of the θ values
We can avoid computing the denominator because
- The sum of the probabilities need to be 1
So, for discrete parameters:
- Posterior probabilitiy = relative plausibility / sum of relative plausibilities
How About the Denominator?
Numerator: relative posterior plausibility of the θ values
We can avoid computing the denominator because
- The sum of the probabilities need to be 1
So, for discrete parameters:
- Posterior probabilitiy = relative plausibility / sum of relative plausibilities
However, the denominator is useful for computing the Bayes factor
Summarizing a Posterior Distribution
Simulate (i.e., draw samples) from the posterior distribution
th <- seq(.05, .95, by = .10)pth <- c(.01, .055, .10, .145, .19, .19, .145, .10, .055, .01)py_th <- th^1 * (1 - th)^4pth_y_unscaled <- pth * py_thpth_y <- pth_y_unscaled / sum(pth_y_unscaled)post_samples <- sample(th, size = 1000, replace = TRUE, prob = pth_y)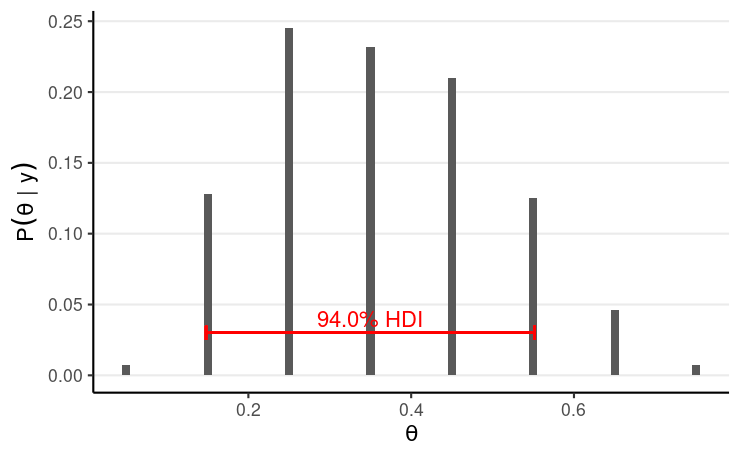
># mean median sd mad ci.1 ci.9 ># 0.360 0.350 0.143 0.148 0.150 0.550Influence of more samples
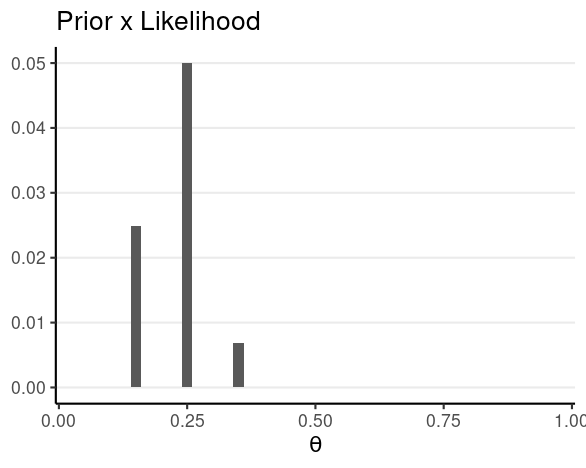
N = 40, z = 10
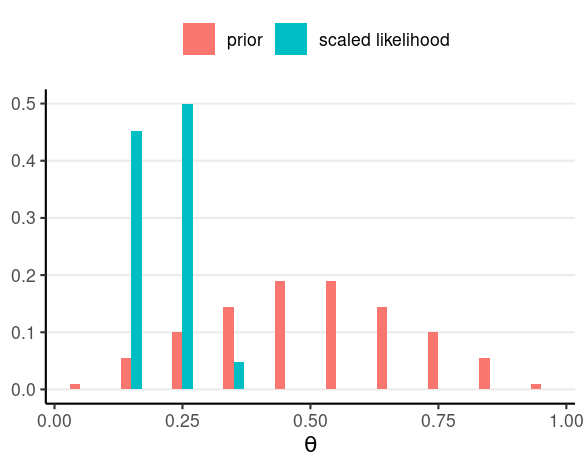
Influence of more samples
N = 40, z = 10

Influence of more informative priors
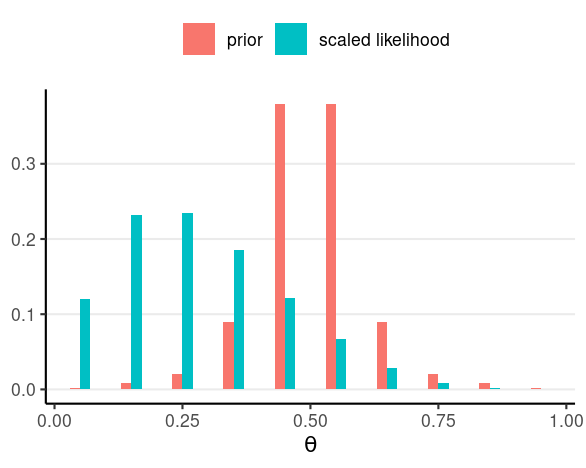
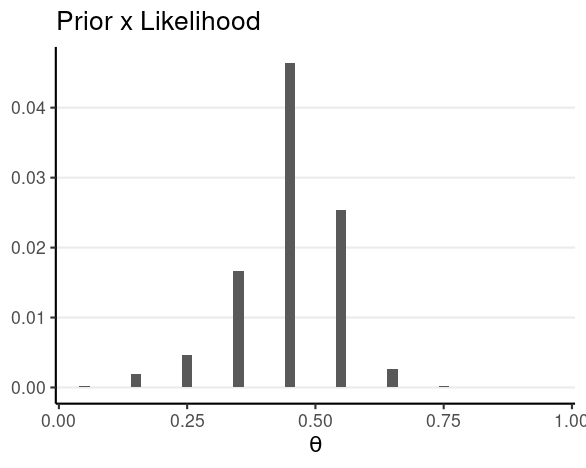
N = 4, z = 1
Influence of more informative priors
N = 4, z = 1

Influence of more informative priors
N = 4, z = 1


The prior needs to be well justified
Prior Predictive Distribution
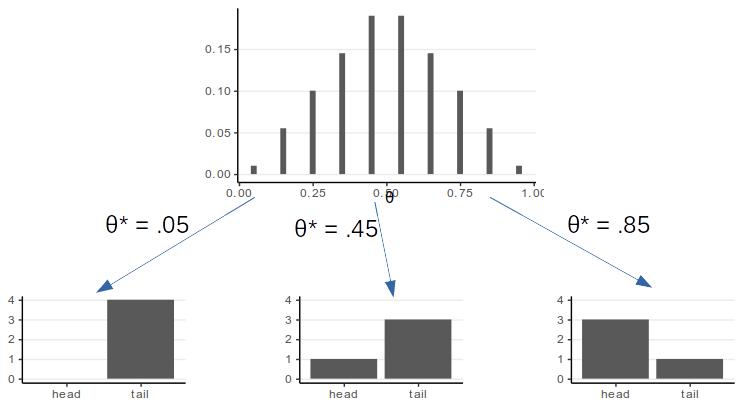
Bayesian models are generative
Simulate data from the prior distribution to check whether the data fit our intuition
Clearly impossible values/patterns?
Overly restrictive?
P(y)=∫P(y|θ∗)P(θ∗)dθ∗: Simulate a θ∗ from the prior, then simulate data based on θ∗
Criticism of Bayesian Methods
Criticism of "Subjectivity"
Main controversy: subjectivity in choosing a prior
- Two people with the same data can get different results because of different chosen priors
Counters to the Subjectivity Criticism
With enough data, different priors hardly make a difference
Prior: just a way to express the degree of ignorance
- One can choose a weakly informative prior so that the Influence of subjective Belief is small
Counters to the Subjectivity Criticism 2
Subjectivity in choosing a prior is
Same as in choosing a model, which is also done in frequentist statistics
Relatively strong prior needs to be justified,
- Open to critique from other researchers
Inter-subjectivity → Objectivity
Counters to the Subjectivity Criticism 3
The prior is a way to incorporate previous research efforts to accumulate scientific evidence
Why should we ignore all previous literature every time we conduct a new study?